
Power Mapping: A Facilitation Guide
Assignment design, classroom facilitation, and grading techniques for power mapping.

This is the third article in a three-part series that explains the why, what, and how of power mapping and how to integrate it into your teaching. Feel free to revisit the previous two articles below if you’d find the background info helpful.


What is Power Mapping?
Power mapping—also commonly referred to as stakeholder mapping and power analysis—is a process that involves creating a visual representation of how stakeholders in a system interact with each other in pursuit of individual and/or collective goals. I realized that this process—one that I used as a master’s degree student who was trying to demystify school district bureaucracies in my Policy Analysis in Education class—could help my Education Technology students understand why ed tech is important and how they can apply their skills to solve real problems in their respective schools.
If you want more background about what power mapping is and how it can be helpful for your teaching, feel free to check out the first article of this series by clicking the button below.
How Can You Use Power Mapping In the Classroom?
Power Mapping can be a fruitful learning activity for students at all levels when appropriately designed for the grade level of instruction. The existing resources around power mapping seem to be focused on engaging adult learners, but successful middle and high school integrations are possible when thoughtfully designed.
This section explains how to design and facilitate a power mapping activity in 5 steps.
1) Ask students to create a list of problems that are impacting their community (5 minutes)
A student-centered approach to introducing power mapping involves asking them to identify key issues related to a core topic of your class that they feel a personal connection to. Power mapping can be done individually or in small groups, but I recommend having students do this during class time in groups. I find that for activities like this, students are more engaged when they’re in groups. This activity is also easier for instructors to facilitate in groups rather than having to tend to each student’s individual questions; they can try solving problems together before bringing them to you.
You can start the activity by giving students a 5-minute free writing period where they list and briefly explain what they feel are the most pressing problems in their communities. In my education technology class, I wanted students to identify ed tech problems in their respective schools and districts. Below is the slide that I used to introduce the free writing part.

I asked students to free write for 5 minutes in response to the following prompt: What technology-oriented challenges do you see in your school? Why is this a problem? I also encouraged them to think about digital and physical technologies.
In summary, this step encourages students to consider the following:
What [insert topic/academic subject] problems do I see in my community (school district, neighborhood, local economy, etc.)?
Why is this a problem?
What are the negative consequences of each problem? Who faces those consequences?
Who benefits from the problem’s existence?
2) Invite each group to create a problem statement that prioritizes one key issue and who’s most affected (15 minutes)
Setting Up the Groups and Creating The Problem Statements:
Ask students to reorder their list of problems with the most important problems at the top of the list. This part should also be independent.
Assign students to random groups (a random number count-off is fine). In my class, I ask them to navigate to either a giant sticky note on the wall (I set those up before class started) or a blank space on the chalkboard at the front of the room.
Once students are in their assigned groups, ask each student to share the top two problems on their list with their group members, along with a brief explanation of why that problem is important to solve.
Ask each group to create a list that includes at least one problem from each group. The group might choose to add a student’s second-most-important problem to the list if it better aligns with the rest of the problems expressed in the group.
Ask each group to form a mini-problem statement: a one-sentence description that encapsulates the theme they’ve identified. Challenge students to use active voice when writing their statements (ex, “Rural high schoolers’ lack of access to physical learning tools” instead of “Absence of physical learning tools for those who lack access”). Ask each group to write the problem statement on a board or giant sticky note so that it’s easily visible.
Problem statements are usually a paragraph long and require a more rigorous, evidence-based approach to crafting them. But an abbreviated statement grounded in students’ lived experience was the priority for this activity.
Ask for a volunteer from each group. Or, you can do what I do: ask each group to identify the youngest group member. Each group will create a power map of their youngest classmate’s school district.
I teach an unconventional college-level course for high school students that involves students who all attend different schools in different school districts across the country. I ask students to focus on a school district because I teach an education technology class. You should choose a system that reflects the context of the problems you want students to critically engage with. For example, an agriculture course might ask students to create a power map of their local grocery store, or the city council if they’re looking to integrate a city-wide solution to an agricultural problem, or the US factory farming industry if you want students to think at the macro level. You might find that it’s most beneficial to ask students what system they think they should investigate, based on their understanding of who they think is creating or maintaining the problem. This might require additional time and scaffolding.
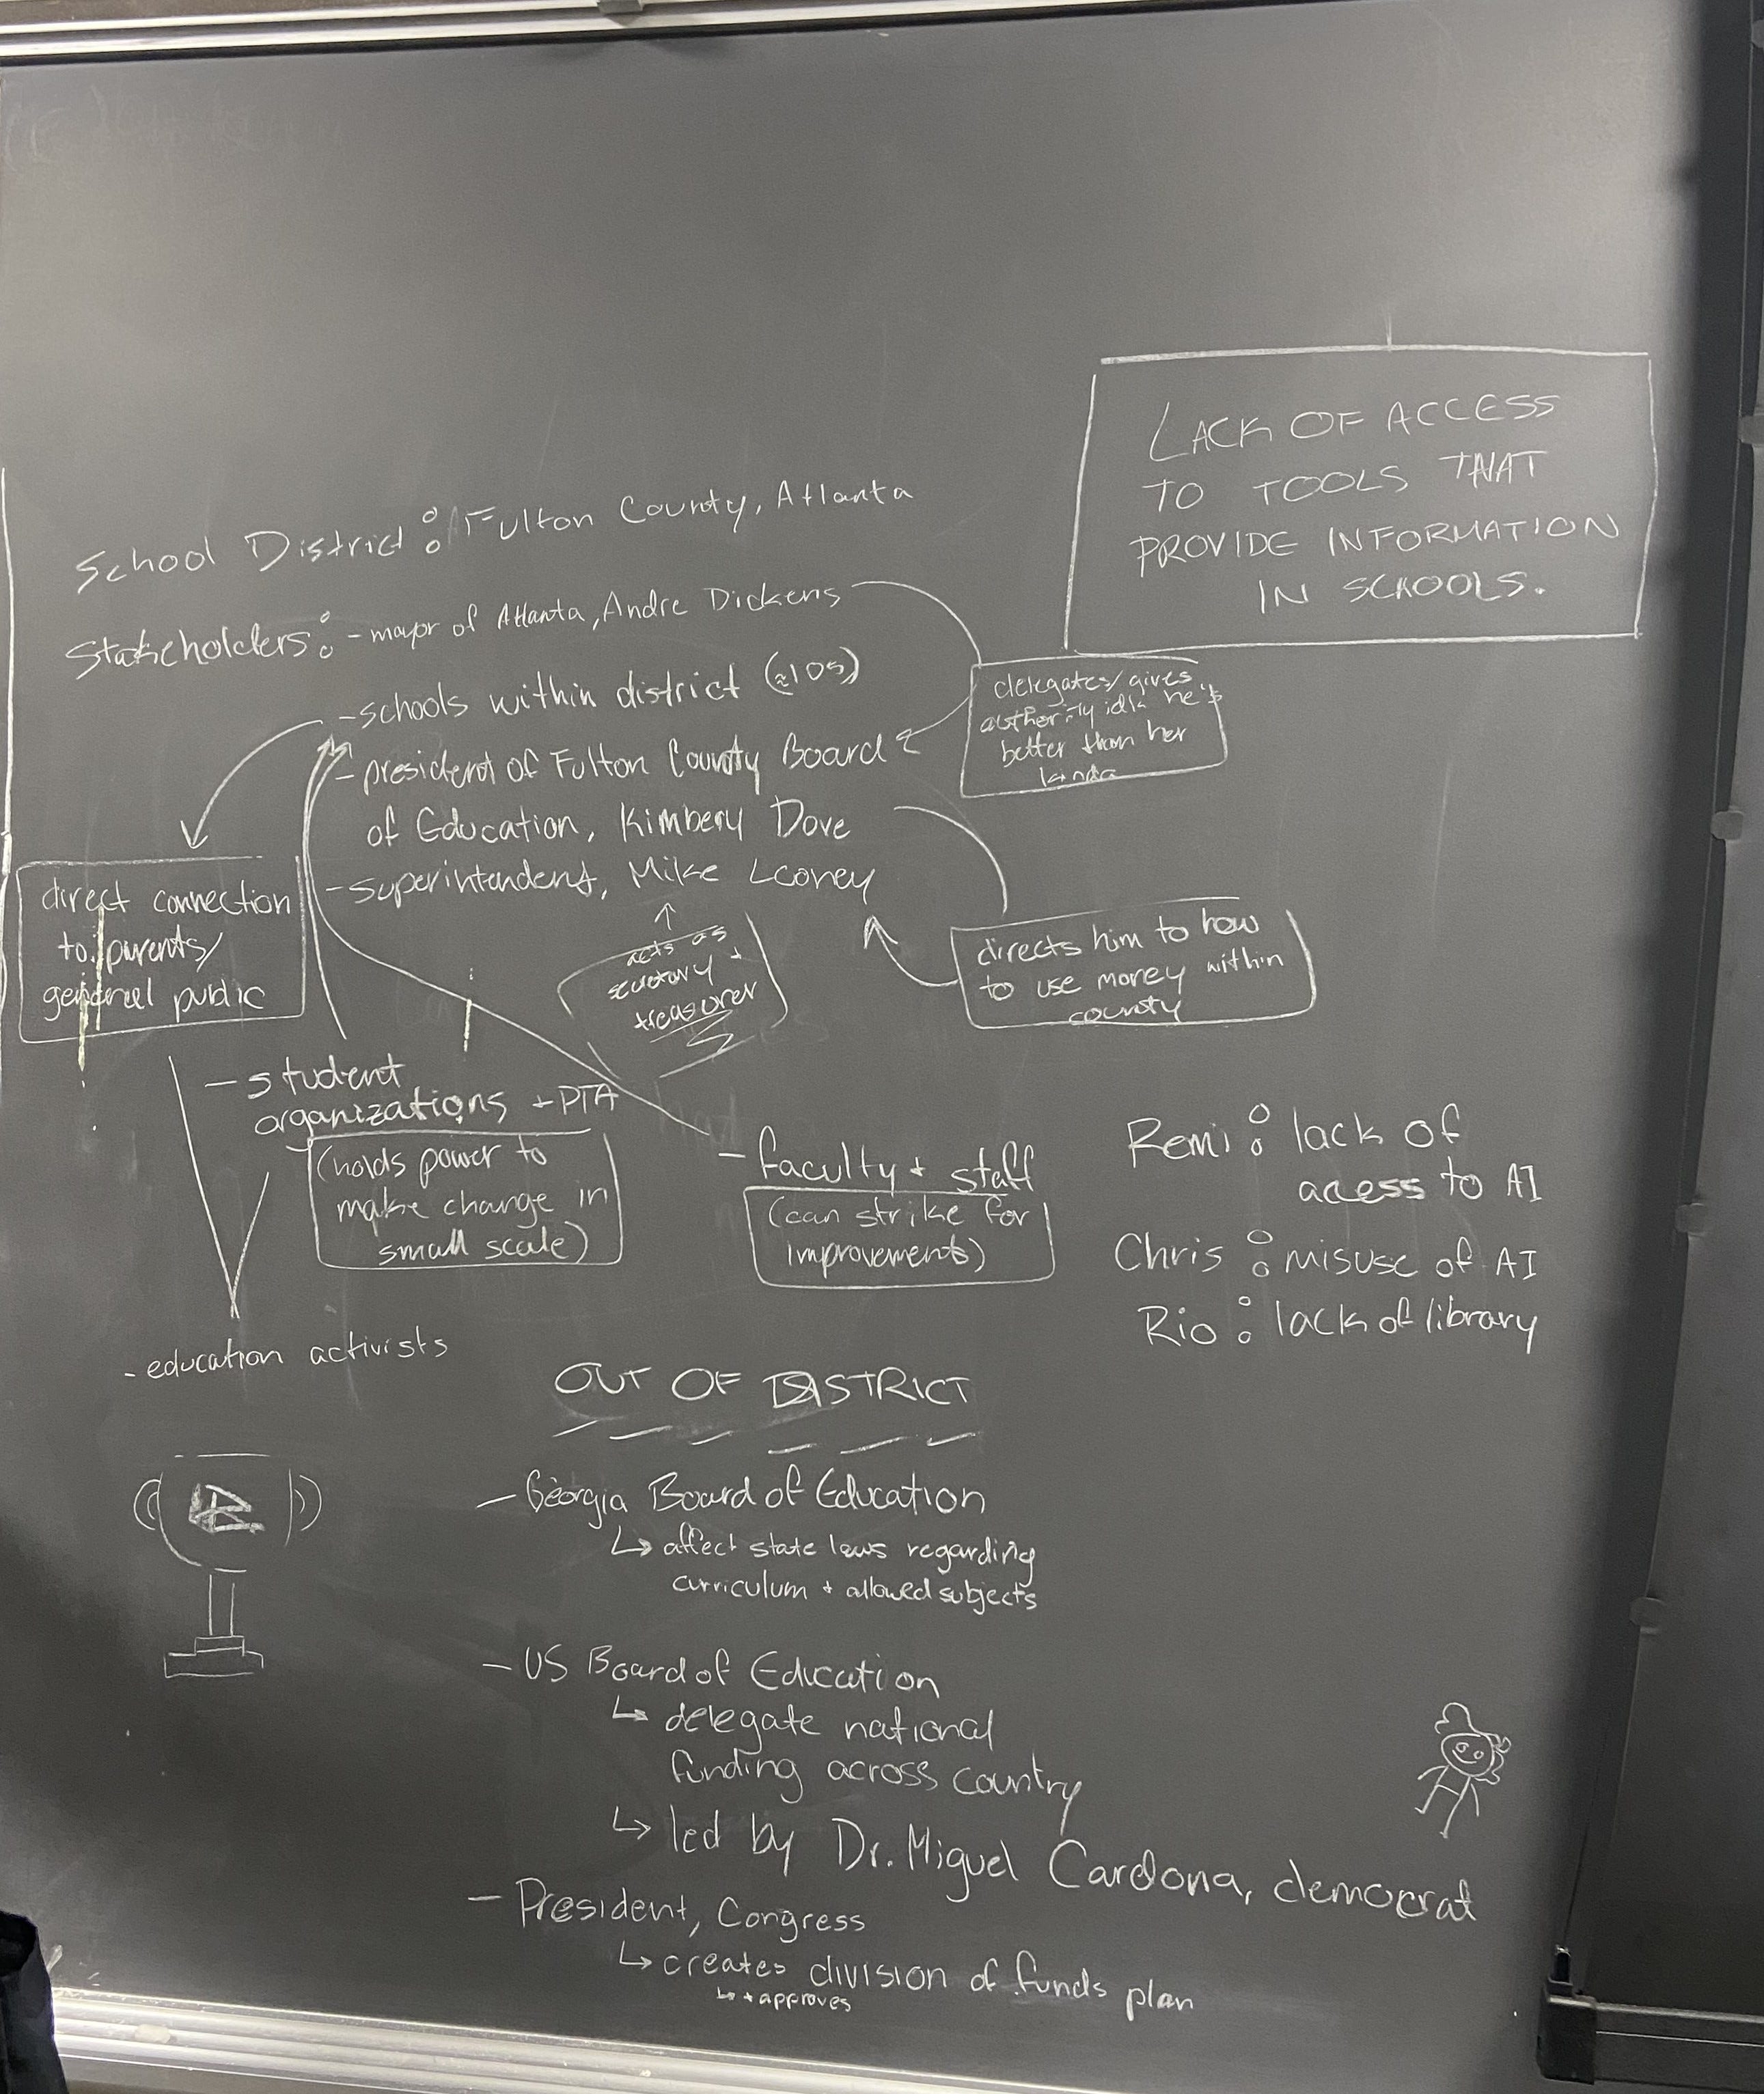
Here’s an example of how three students’ top problems form their group’s problem statement :
Remi’s top problem: lack of access to AI
Chris’s top problem: misuse of AI
Rio’s top problem: lack of a library in the school
Group 1’s problem statement: Lack of access to tools that provide information to schools (I should have challenged students to rewrite this statement in active voice).
The problem statement will guide students’ creation of their power map, with the goal being to visualize who’s impacted by the problem and in what ways. As they complete their map throughout the class session, the connections between the problems that each student originally brought to the group become clearer. I hover around each group and ask questions that help them think about the long list of problems they’ve been asked to condense into a single statement.
Once each group has their problem statement, they’re invited to give their group a name that reflects the problem(s) in their district. My favorite group name from last summer was “Larry’s Laptops.” Larry is the first name of the Chief Academic Officer of this group’s charter school district.
In summary, this step encourages students to consider the following:
Which problems do you feel have the biggest consequences?
What major theme(s) do you see across the problems you’ve listed?
Is there a sequential connection to these problems? Is it advantageous to focus on solving one problem before others? Why?
3) Name relevant stakeholders and visually represent their relationship to each other (30-45 minutes)

Facilitating Students’ Creation of the Power Map:
After students have their problem statement and know what community or system they’ll focus on, share instructions for how to create the power map. When I facilitate the activity, I show the slide above and share a sentence or two about each bullet point and its intention. I remind students that there’s no wrong way to create the map, that they should focus on one bullet point at a time, and that they should use their phones and laptops to research the entities and relationships between those entities.
Here are the bulleted instructions that I share with them before starting the activity. These instructions stay on the board for the duration of the activity:
Start with a school district.
List all of the stakeholders within the school district that your group thinks are either impacted by or influencing the problem.
Use mapping to draw the relationship between stakeholders. Who has influence over whom, and in what ways? How do decisions surrounding your problem get made?
Who outside of the school district has power over those within your school district?
Assign an “L”, “M”, and “H” to each stakeholder listed to indicate whether that stakeholder has a low, medium, or high level of influence over other stakeholders in the map (more on this step in section 4)
You’ll likely need to reiterate these instructions for students. This activity starts with a heavy logistical lift, but once students get the hang of it, they get really into it, and their questions become more about the content and implications of the map instead of the logistics of the activity.
In summary, this step encourages students to consider the following:
Who’s most impacted by the problem?
Who has the power to change it?
Who is usually excluded from decision-making processes surrounding the problem?
Who does each stakeholder have to report to/answer to? What resources do stakeholders find valuable that these people have?
4) Identify and empathize with the most relevant stakeholders (20-30 minutes)
Students use the “L”, “M”, and “H” they’ve assigned to each stakeholder to identify the most relevant stakeholders related to their social issue. They’re then challenged to empathize with that stakeholder with the goal of building an advocacy/implementation strategy for whom the stakeholder is the target audience. For a power map of a school district, my students use sources such as local and national news articles, interviews, press releases, district websites, organizational charts, strategic plans, budgets, and other publicly available records, and public statements to understand the extent of the problem and how stakeholders are framing it.
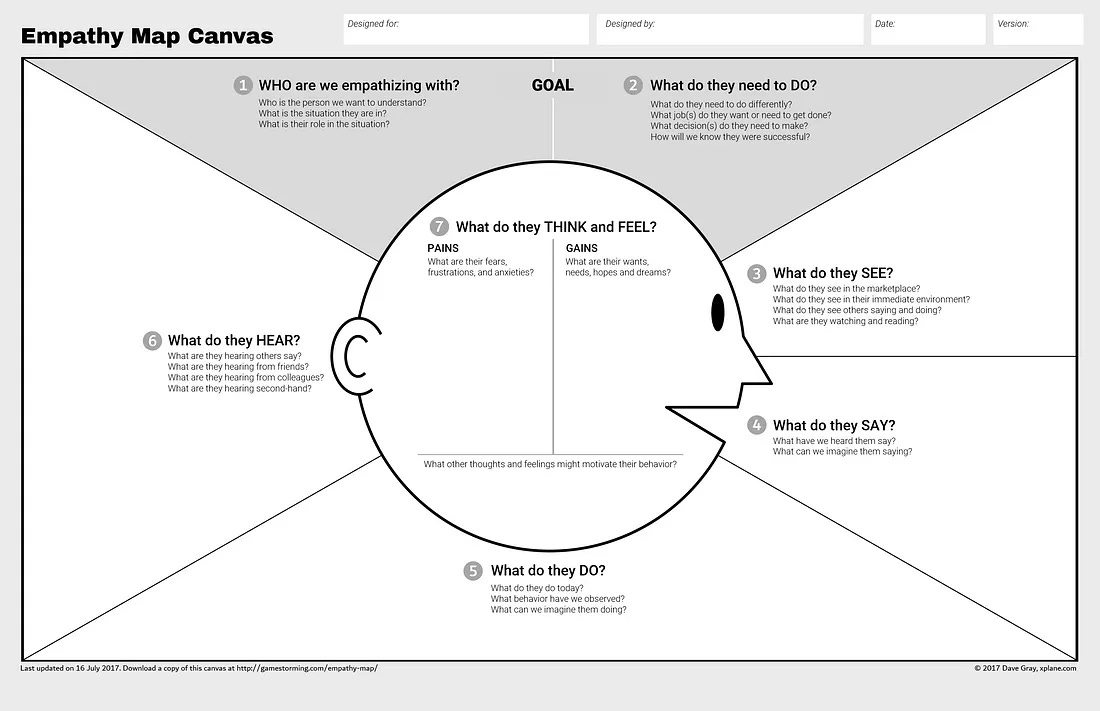
For this part, it may help students to annotate their map with quotes, examples, and notes explaining aspects of the map. For longer projects, students might complete an empathy map for a stakeholder or conduct an email or Zoom interview with real people impacted by the issue. Empathy mapping is when a student focuses on a specific stakeholder and investigates that stakeholder’s feelings, motivations, and experiences to inform their advocacy. Below is an empathy mapping template, which I print out for my students. This is an optional resource, and I don’t collect or grade students’ completion of the empathy map.
In summary, this step encourages students to consider the following:
Who in this map has the biggest influence over the state of the problem?
What are their needs, motivations, and concerns?
How do they perceive the problem? Does this perception align with yours?
5) Co-design viable solutions and strategize advocacy efforts (10-15-minute debrief, independent work for the remainder of the course)
After this activity, I facilitate a debrief with students, asking them two questions:
What did this activity reveal about your current or future role in solving problems in education (as a current student, future professional/parent, community member, etc.)?
What was most challenging and/or enjoyable about this activity?
Final Project Prototype Assignment - Education Technology
After a few minutes of debriefing, we discuss how empathy mapping connects to their individual final assignment. For context, I’ve listed an abbreviated description of the final assignment below:
This assignment challenges you to utilize the many skills you’ve learned in this class to solve a learning problem/challenge with a solution that either: 1) has a technological component (ex: a digital technology that transforms classroom engagement, a new VR application that enhances learning in a particular subject, etc.), and/or 2) impacts how technology is used in learning environments (ex: a new policy that expands access to broadband internet for rural communities)
Use the design thinking process and the different frameworks and theories we’ve learned, like Bloom’s taxonomy, chunking, interleaving, and our policy analysis frameworks to design a solution to a learning challenge. I would like you all to pay specific attention to the first three steps of the design thinking process: empathize, define, and ideate. Think back to our activity on the first day where we drew empathy map for our worst and best teachers. I will give feedback related to how intentional you are about discovering the needs of your learners and meeting them with a solution using the technologies and education practices we’ve learned.
Your deliverable will be a digital prototype, which you will have 5-minutes to present a 5-minute presentation and must contain an element that includes audio/visual media. This can be a classic PowerPoint, a mini podcast, an AI-generated piece of media, a digital diagram/blueprint of a classroom, a website or product mock up, an online policy report, etc. The prototype can be different from the medium through which you intend to present the prototype. For example, if your prototype is a software as a service (SaaS) application, you might present mock ups of the app/website via Google Slides or PowerPoint - you do not have to have a functioning website in order for the prototype to be valuable. Use whichever medium best captures your process.
The deliverable should be just as much about how you navigated through the design thinking process as it is your prototype/solution.
We spend time discussing how the power mapping exercise aligns with the type of design thinking and stakeholder empathy that I expect to see reflected in their project. One student used his coding skills to build a binary AI model that used voice detection to detect whether a professor’s lectures are inclusive and engaging. Another student drafted federal legislation that aimed to secure affordable and reliable internet access to impoverished neighborhoods. Power mapping is a powerful practice on its own. It doesn’t have to be connected to a bigger project. However, since this will likely take up an entire class period, you might want to see students continue to practice and apply the skills they learned in this activity throughout the course.
In summary, this step encourages students to consider the following:
What skills, interests, and expertise do you have that can help influential stakeholders implement a solution?
How can you include stakeholders in the design of your solution?
Which mediums do stakeholders use to hear and share messages about the problem?
Power Mapping Examples
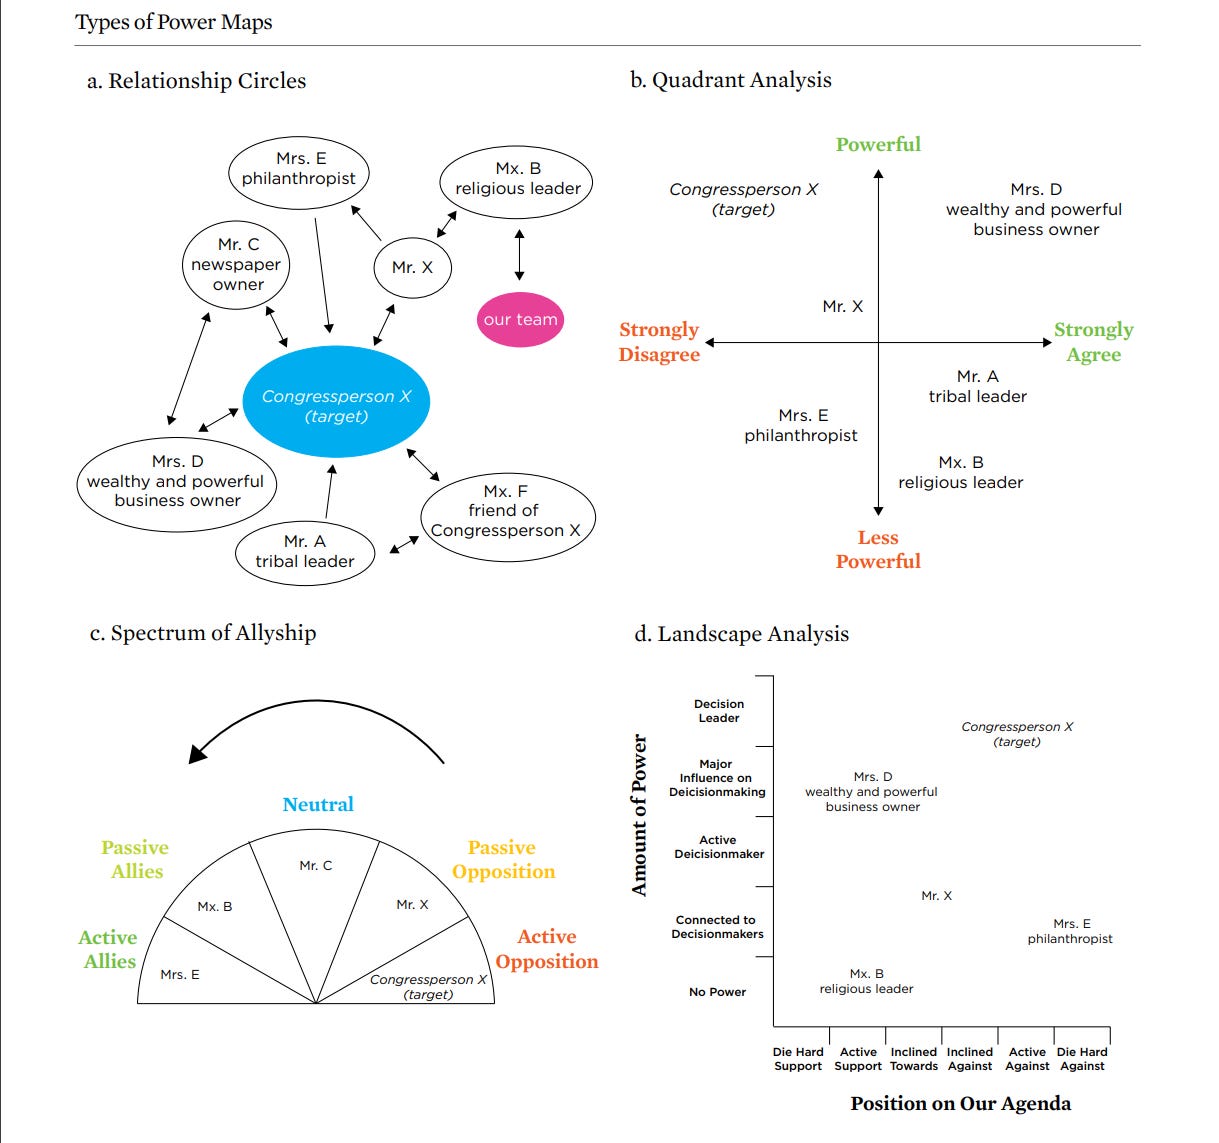
The resource below from the Union of Concerned Scientists (2018) shows four different types of power maps: relationship circles, quadrant analysis, spectrum of allyship, and landscape analysis. The authors of this resource state that different options may work better for different use cases, depending on the complexity of the problem being examined and the information that the map creator is hoping to uncover.
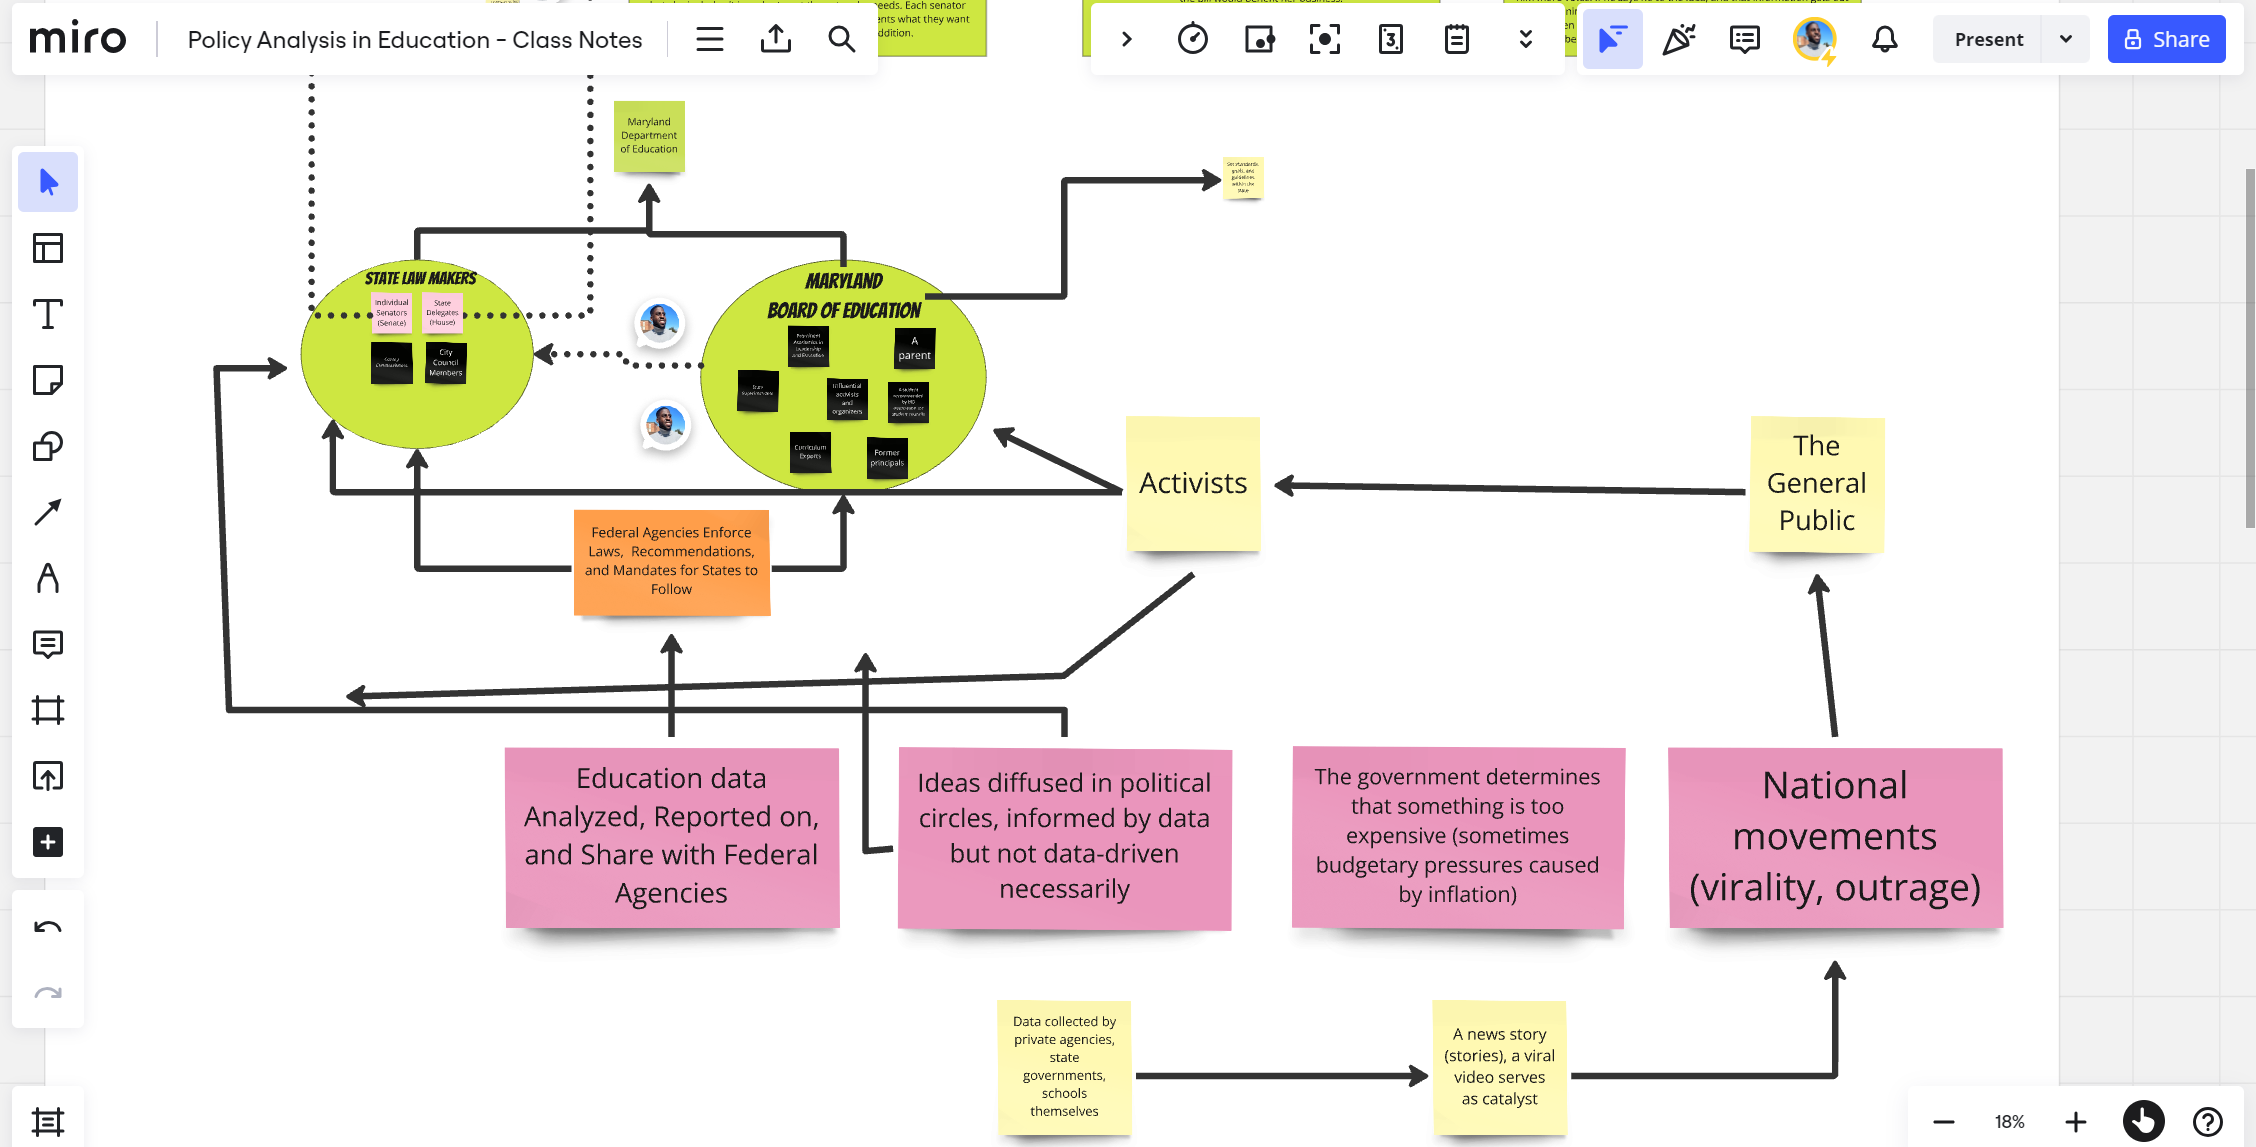
The screen captures below are a power map that I created in grad school of Maryland’s legislative process for state-wide education decisions. I used Miro to visualize decision-making power, resources, communication patterns, and value systems that undergird activity between stakeholders in Maryland.

How to Grade A Power Map
My in-class power mapping activity is an ungraded assignment. I view power mapping as a practice opportunity that supports progress toward their final project. However, if you find it helpful to grade this activity, this section walks through just that.
When grading and giving students feedback on their power maps, it’s important to focus on the accuracy of the map, the process by which students arrived at their completed maps (assessing students’ information literacy skills), and what the power map reveals about the issue they’re investigating. It’s also important to give students feedback on the following:
Metacognitive awareness - demonstration of how the power map either challenged or confirmed their understanding of the problem/topic. Also, students’ capacity to explain what their hang-ups were during the power mapping process. They might answer questions like, “Why is it hard to figure out which school board members signed off on district policy?”
Use of active voice - to describe examples of how stakeholders in a system use their power to influence decision making; active voice requires students to understand who has decision-making power over whom, whether directly or indirectly
Stakeholder empathy - the extent to which their map and proposed solution considers the motivations and fears of stakeholders; their ability to empathize with stakeholders and consider their lived experiences when designing the solution
Critical analysis of their role in the system - the ability to convey an evidence-based advocacy strategy that they are involved in; defending their action plan by presenting decision-making patterns and historical precedent collected through relevant sources
Application of cumulative skills - how their analysis of the problem through the power map includes vocabulary, theory, and practical skills learned throughout the course
When giving students feedback, explain what you experienced when viewing their power map for the first time. Explain to students your feelings of confusion, overwhelm, clarity, and/or ease of use, and what about the map made you feel that way. This feedback can prepare students to share power maps with colleagues in a future professional setting.
Use policy analysis frameworks relevant to your discipline, and assess students’ use of those frameworks to reveal different truths about the problem.
Do you have ideas for how you’d integrate power mapping into your course? Click the button below to leave a comment!